Standard deviation is an important statistical measure that indicates how spread out or varied a set of data points is from the mean. A higher standard deviation means the data is more scattered, while a lower standard deviation indicates it is clustered more closely around the mean.
In an online Excel sheet, calculating standard deviation is straightforward thanks to built-in functions. In this guide, we’ll walk through the steps to find standard deviation using Excel’s STDEV feature. We’ll also look at some additional options and use cases. Follow along to learn how to derive key statistical insights from your data.
- Calculate Standard Deviation in Excel using STDEV Function
Step 1: Enter Your Data
Start by entering your data set into an Excel spreadsheet. For example, let’s assume you have a set of data in column A:
| A |
| 25 |
| 30 |
| 28 |
| 35 |
| 32 |
Step 2: Use the STDEV Function
The STDEV function in Excel calculates the standard deviation of a data set. Here’s how to use it:
- Select an empty cell where you want the standard deviation result to appear.
- Type the following formula: “=STDEV(A1:A5)” In this example, the data set is in cells A1 to A5. Adjust the range as per your data.
- Press Enter.
Excel will calculate and display the standard deviation of the data set in the selected cell.
Step 3: Interpreting the Result
The standard deviation is a measure of how spread out the values are in the data set. A higher standard deviation indicates greater variability, while a lower standard deviation indicates less variability.
For example, if the standard deviation is calculated as 3, it means that the data points are, on average, 3 units away from the mean value.
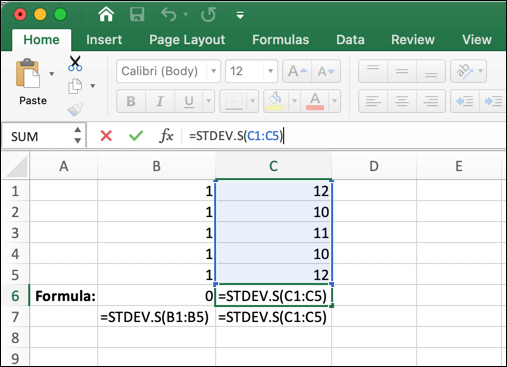
II. Using STDEV.S Function (Sample Standard Deviation)
The STDEV.S function is used when you have a sample dataset and want to calculate the sample standard deviation. The formula for the sample standard deviation is slightly different from the formula used for the population standard deviation.
Here’s how to use the STDEV.S function in Excel:
- Open Microsoft Excel and enter your dataset in a column. For example, let’s use cells A1 to A10 for the data.
- In an empty cell where you want to display the result, type the following formula: =STDEV.S(A1:A10)
Note: Replace A1:A10 with the range that contains your data.
- Press Enter to calculate the standard deviation.
III. STDEV.P Function (Population Standard Deviation)
The STDEV.P function is used when you have an entire population dataset and want to calculate the population standard deviation. This function uses a slightly different formula compared to the STDEV.S function.
Here’s how to use the STDEV.P function in Excel:
- Follow the same steps as above to enter your dataset in a column and leave an empty cell for the result.
- In the empty cell, type the following formula: =STDEV.P(A1:A10)
Note: Replace A1:A10 with the range that contains your data.
- Press Enter to calculate the population standard deviation.
IV. How to Calculate Standard Deviation in Excel using a Manually Approach
Step 1: Enter Data in Excel
Start by entering your dataset into an Excel spreadsheet. For example, let’s consider a set of values in column A:
| A |
| 2 |
| 4 |
| 6 |
| 8 |
| 10 |
Step 2: Calculate the Mean (Average)
To calculate the standard deviation, you first need to calculate the mean (average) of the dataset. Excel has a built-in function called AVERAGE that makes this task easy. Follow these steps:
- Select an empty cell where you want to display the mean (average) of the dataset.
- In the formula bar, type =AVERAGE(A1:A5), assuming your dataset is in cells A1 to A5.
- Press Enter. Excel will display the mean value in the selected cell.
Step 3: Calculate the Deviations
Next, you need to calculate the deviations of each data point from the mean. To do this, follow these steps:
- Select an empty column where you want to display the deviations.
- In the first cell of the new column (e.g., B2), type the formula =A2 – $B$1, assuming the first data point is in cell A2 and the mean value is in cell B1.
- Press Enter. Excel will calculate the deviation of the first data point from the mean.
- Drag the fill handle (a small square at the bottom-right corner of the cell) down to copy the formula and calculate deviations for all data points.
Step 4: Calculate the Squared Deviations
To calculate the standard deviation, you need the squared deviations. Follow these steps:
- Select another empty column where you want to display the squared deviations.
- In the first cell of the new column (e.g., C2), type the formula =B2^2, assuming the deviations are in column B.
- Press Enter. Excel will calculate the squared deviation of the first data point.
- Drag the fill handle down to copy the formula and calculate squared deviations for all data points.
Step 5: Calculate the Variance
The variance is the average of the squared deviations. To calculate the variance, follow these steps:
- Select an empty cell where you want to display the variance.
- In the formula bar, type =AVERAGE(C2:C6), assuming the squared deviations are in cells C2 to C6.
- Press Enter. Excel will display the variance in the selected cell.
Step 6: Calculate the Standard Deviation
Finally, to calculate the standard deviation, take the square root of the variance. Follow these steps:
- Select an empty cell where you want to display the standard deviation.
- In the formula bar, type =SQRT(D1), assuming the variance is in cell D1.
- Press Enter. Excel will display the standard deviation in the selected cell.
V. Standard Deviation for Multiple Data Sets
If you have multiple data sets in different columns and want to calculate the standard deviation for each, you can use the same formula with different data ranges. For example:
| A | B |
| 25 | 40 |
| 30 | 42 |
| 28 | 45 |
| 35 | 38 |
| 32 | 41 |
To calculate the standard deviation for columns A and B:
– For column A: Use the formula “=STDEV(A1:A5)’’
– For column B: Use the formula “=STDEV(B1:B5)”
When to Calculate Standard Deviation in Excel
If you are wondering when should you calculate standard deviation in Excel, here are a few examples of when calculating it is useful:
- Analyzing volatility of financial data like stock prices over time.
- Seeing how various medical treatments affect different groups of patients.
- Checking grading curve and test score variability for assessments.
- Evaluating the spread of data in scientific experiments.
- And more! It has wide applications for statistical insights.
Additional Tips for Calculating Standard Deviation in Excel
- If your data contains text or empty cells, the STDEV.S and STDEV.P functions will treat them as zeros in the calculations. Ensure that your data consists only of numerical values for accurate results.
- You can also use the standard deviation functions in combination with other Excel functions, such as AVERAGE and COUNT, to perform more complex statistical analyses.
- Excel also provides other statistical functions related to standard deviation, such as VAR.S, VAR.P, STDEVA, and STDEVP, which offer variance calculations along with standard deviation.
Conclusion
Excel’s built-in STDEV function makes it easy to calculate the standard deviation for a data set. Understanding the standard deviation of your data can provide valuable insights into the spread and variability of the data points. Whether you are analyzing financial data, conducting research, or working with any dataset, knowing how to calculate the standard deviation in Excel can be a powerful tool for data analysis and decision-making.


